Data-driven dynamic reporting offers an elegant and efficient solution for reporting on topics which are underpinned by quantitative data. Digital tools and structured workflows are leveraged to streamline report production and enhance user engagement with complex reports.
What is data-driven dynamic reporting?
Our data-driven dynamic reports use software systems to compile, format and produce reports based on live data sources. Instead of relying on manual editing, automated processes can be configured to analyse data and generate outputs, format sections and deliver reports with consistency and accuracy.
A number of customisable features ease navigation and cross-referencing throughout the document, allow tailoring of styles, formatting and aesthetics, aid with accessibility and comprehension of the material and allow exploration and customised visualisation of data within the document via interactive tables and figures. Examples of some of these features are demonstrated below. An example of a stand-alone digital report can be accessed here.
Overview of selected functionality
Some key features of Natural Powers digital reporting services are provided below, split into features associated with:
Navigation
Reports may be standalone or linked to other documents, as in the case of an Environmental Impact Assessment, which involves multiple reports and technical appendices coming together. The length and density of reporting often hinders navigation and ease of interpretation of the results. Digital formats include features that provide a smoother transition between documents and make all the information only one click away.
Page layout
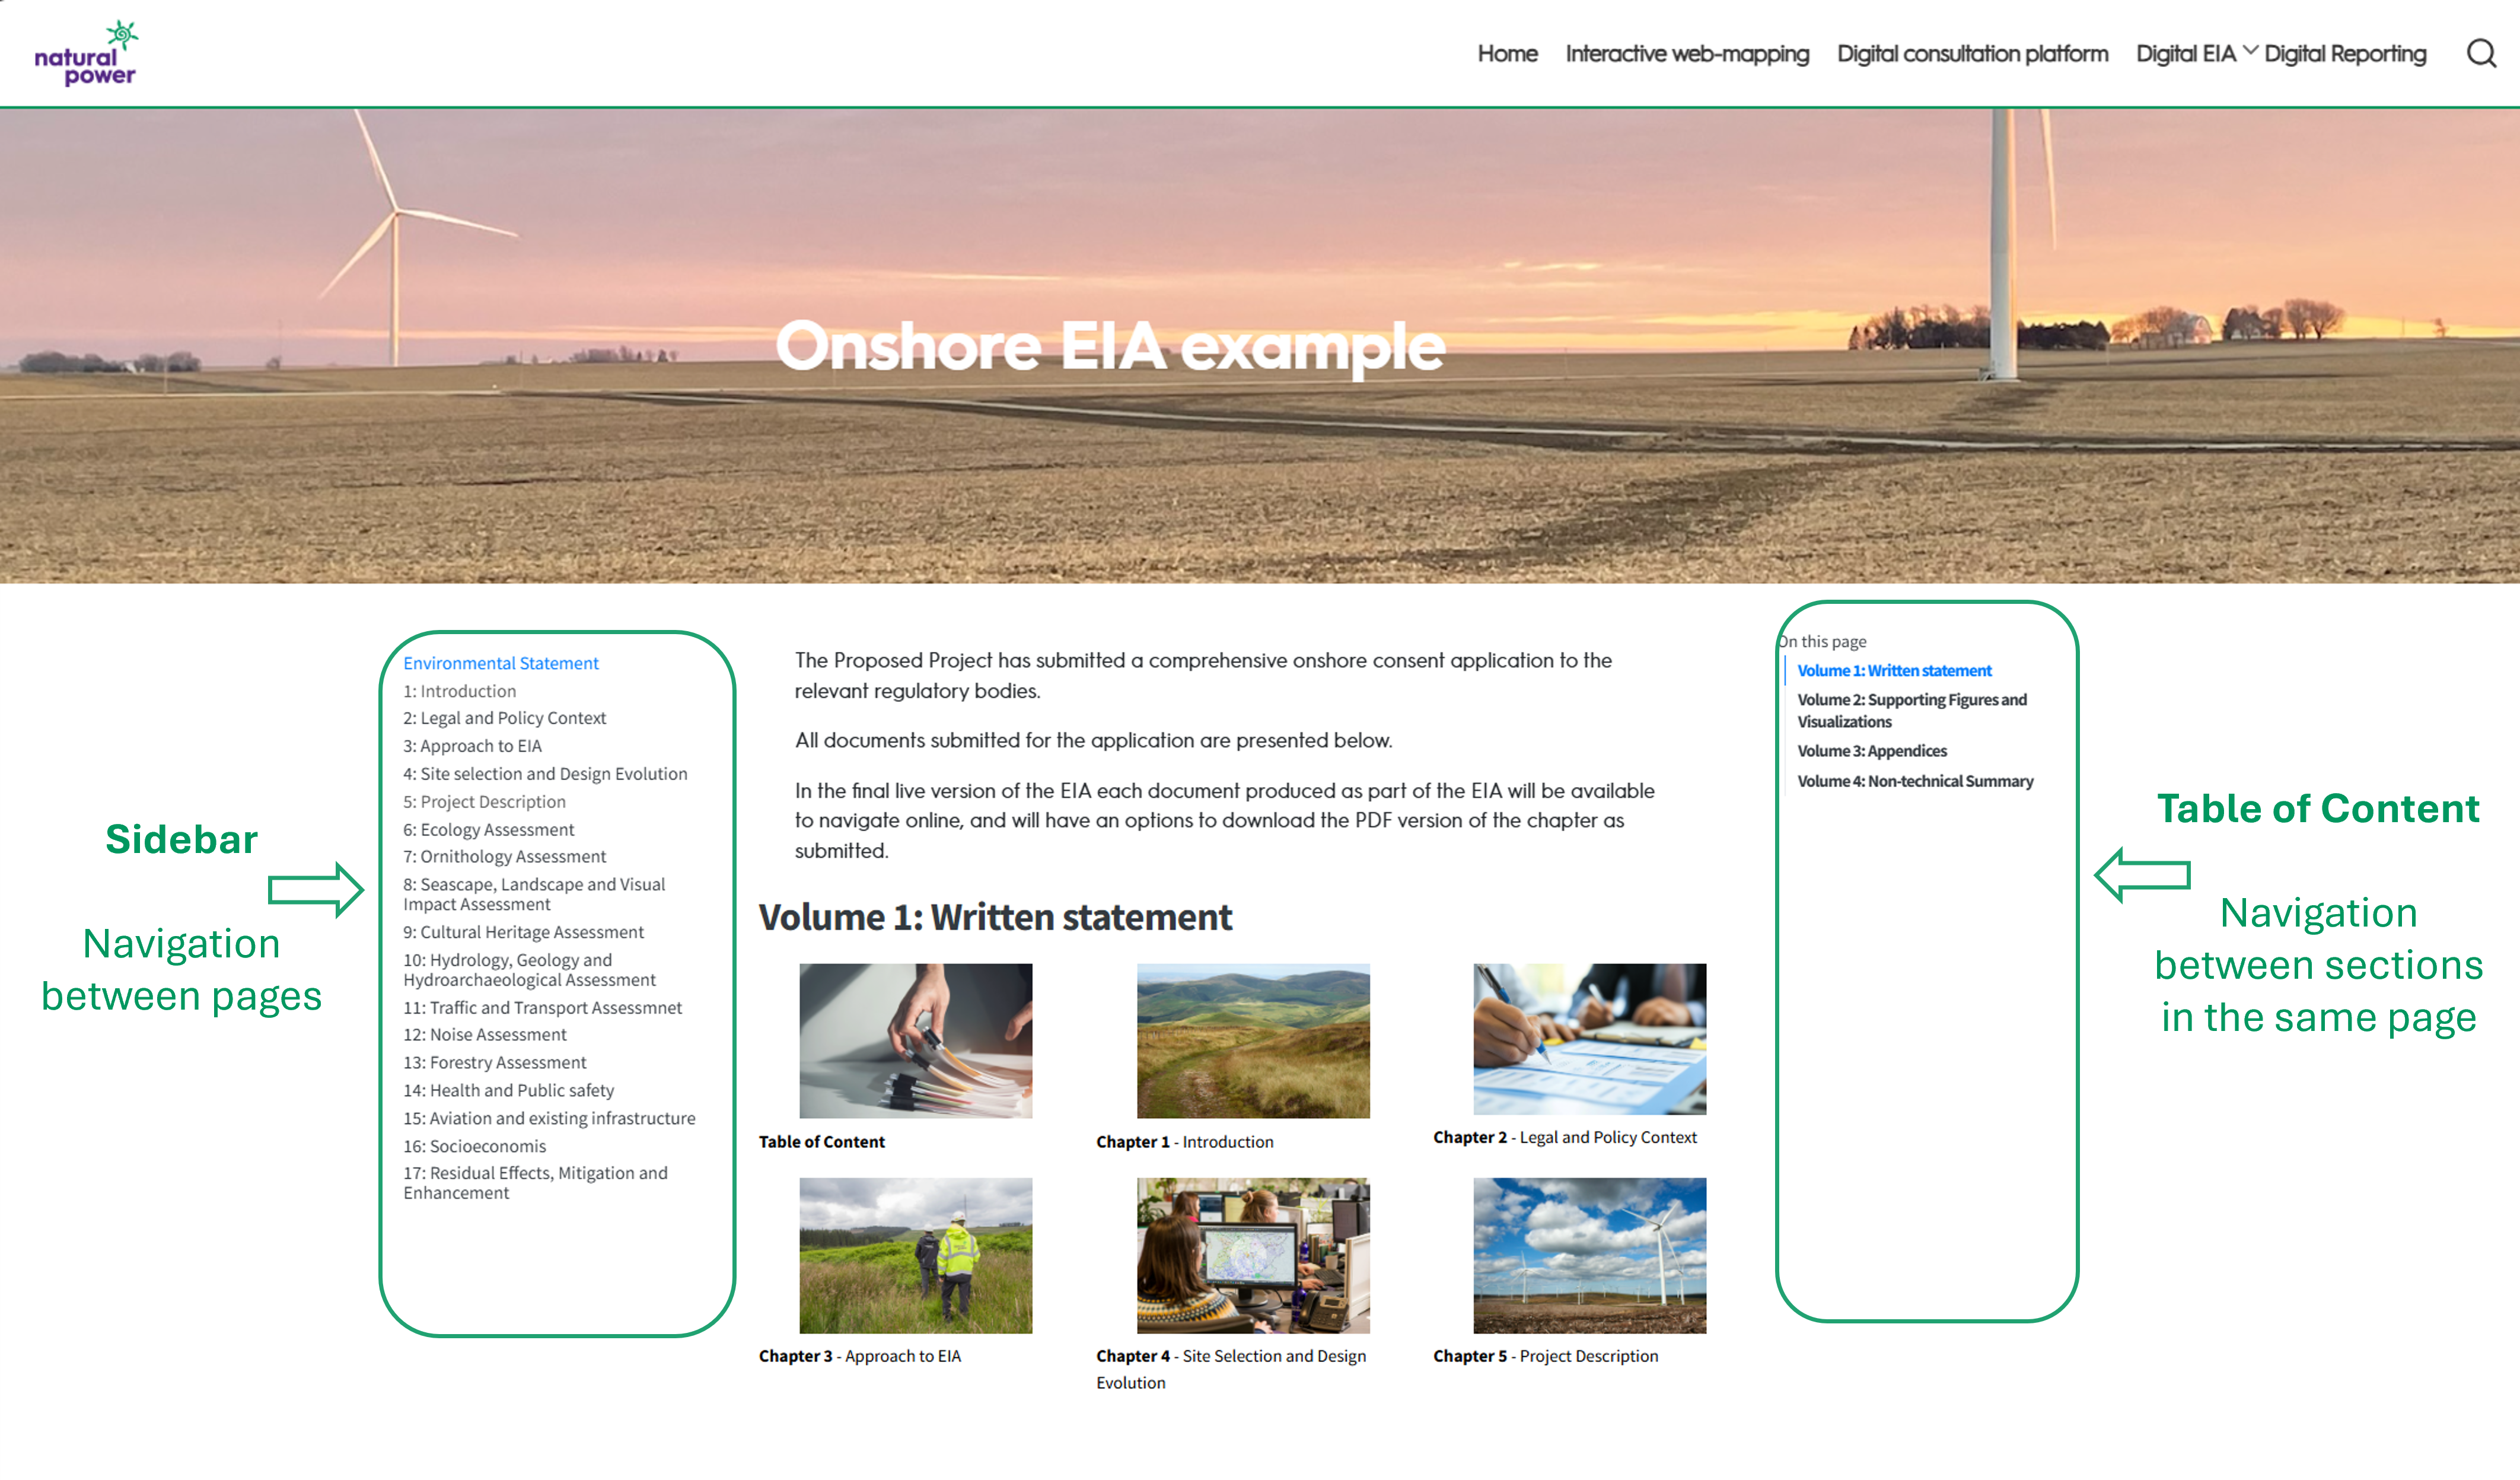
The structure of each page includes a sidebar and a table of content (Figure 1) that allow for simple navigation between other pages within the website or easy selection of main sections within the same page or standalone report. Note the sidebar is fully customisable and can be used to re-direct users to specific relevant documentation. For example by featuring the relevant technical appendices when reading through one of the Environmental Statement chapters.
Hyperlinks
Hyperlinks can also be used to point users towards specific pages or section within a page. All reference of other chapters or technical appendix within a report can be hyperlinked to aid navigation.
Example of hyperlink to another page:
“The website includes pages that summarize the possibilities of using interactive web mapping tools and online forms during the consultation process.”
Example of hyperlink to a section of a page:
“The digital offshore Environmental Statement will include links to each technical appendix provided as supporting documents.”
Report download
On top of presenting the report online each page may include a download button which will allow for the PDF version of the report to be downloaded.
Formatting
Providing additional information or clarifications through the use of footnotes, or by including a glossary and acronym table or a reference list is important to ensure that information are presented as clearly as possible. Digital reports have various ways to convey this additional detail in a clear manner.
Footnotes
Foot notes can either be included at the bottom of the page1. When inserted within approach hovering the mouse on the number of the footnotes will showcase the information in a tooltip, while clicking on the number will take the reader at the bottom of the page where they can visualize the text. A back arrow is provided next to text which will take the reader back to the where the footnote link is found within the text.
However if preferred additional information can also be included in the margin to avoid readers to have to move within the page2.
[2] This is an example of additional information that can be provided in the margin
Glossary and acronyms
Instead of providing a glossary and acronym tables, there are embedded functions that allow this information to appear as tooltip for the required words so that readers can have the information available as and when needed.
Example of glossary for Environmental Statement.
Example of acronym for PDA.
Reference
References will be integrated using Latex functionality which will ensure that all citations are referenced consistently and automatically included into a reference section.
For example: “Seabird sensitivity scores will be sourced from Bradbury et al. (2014).”
Figures
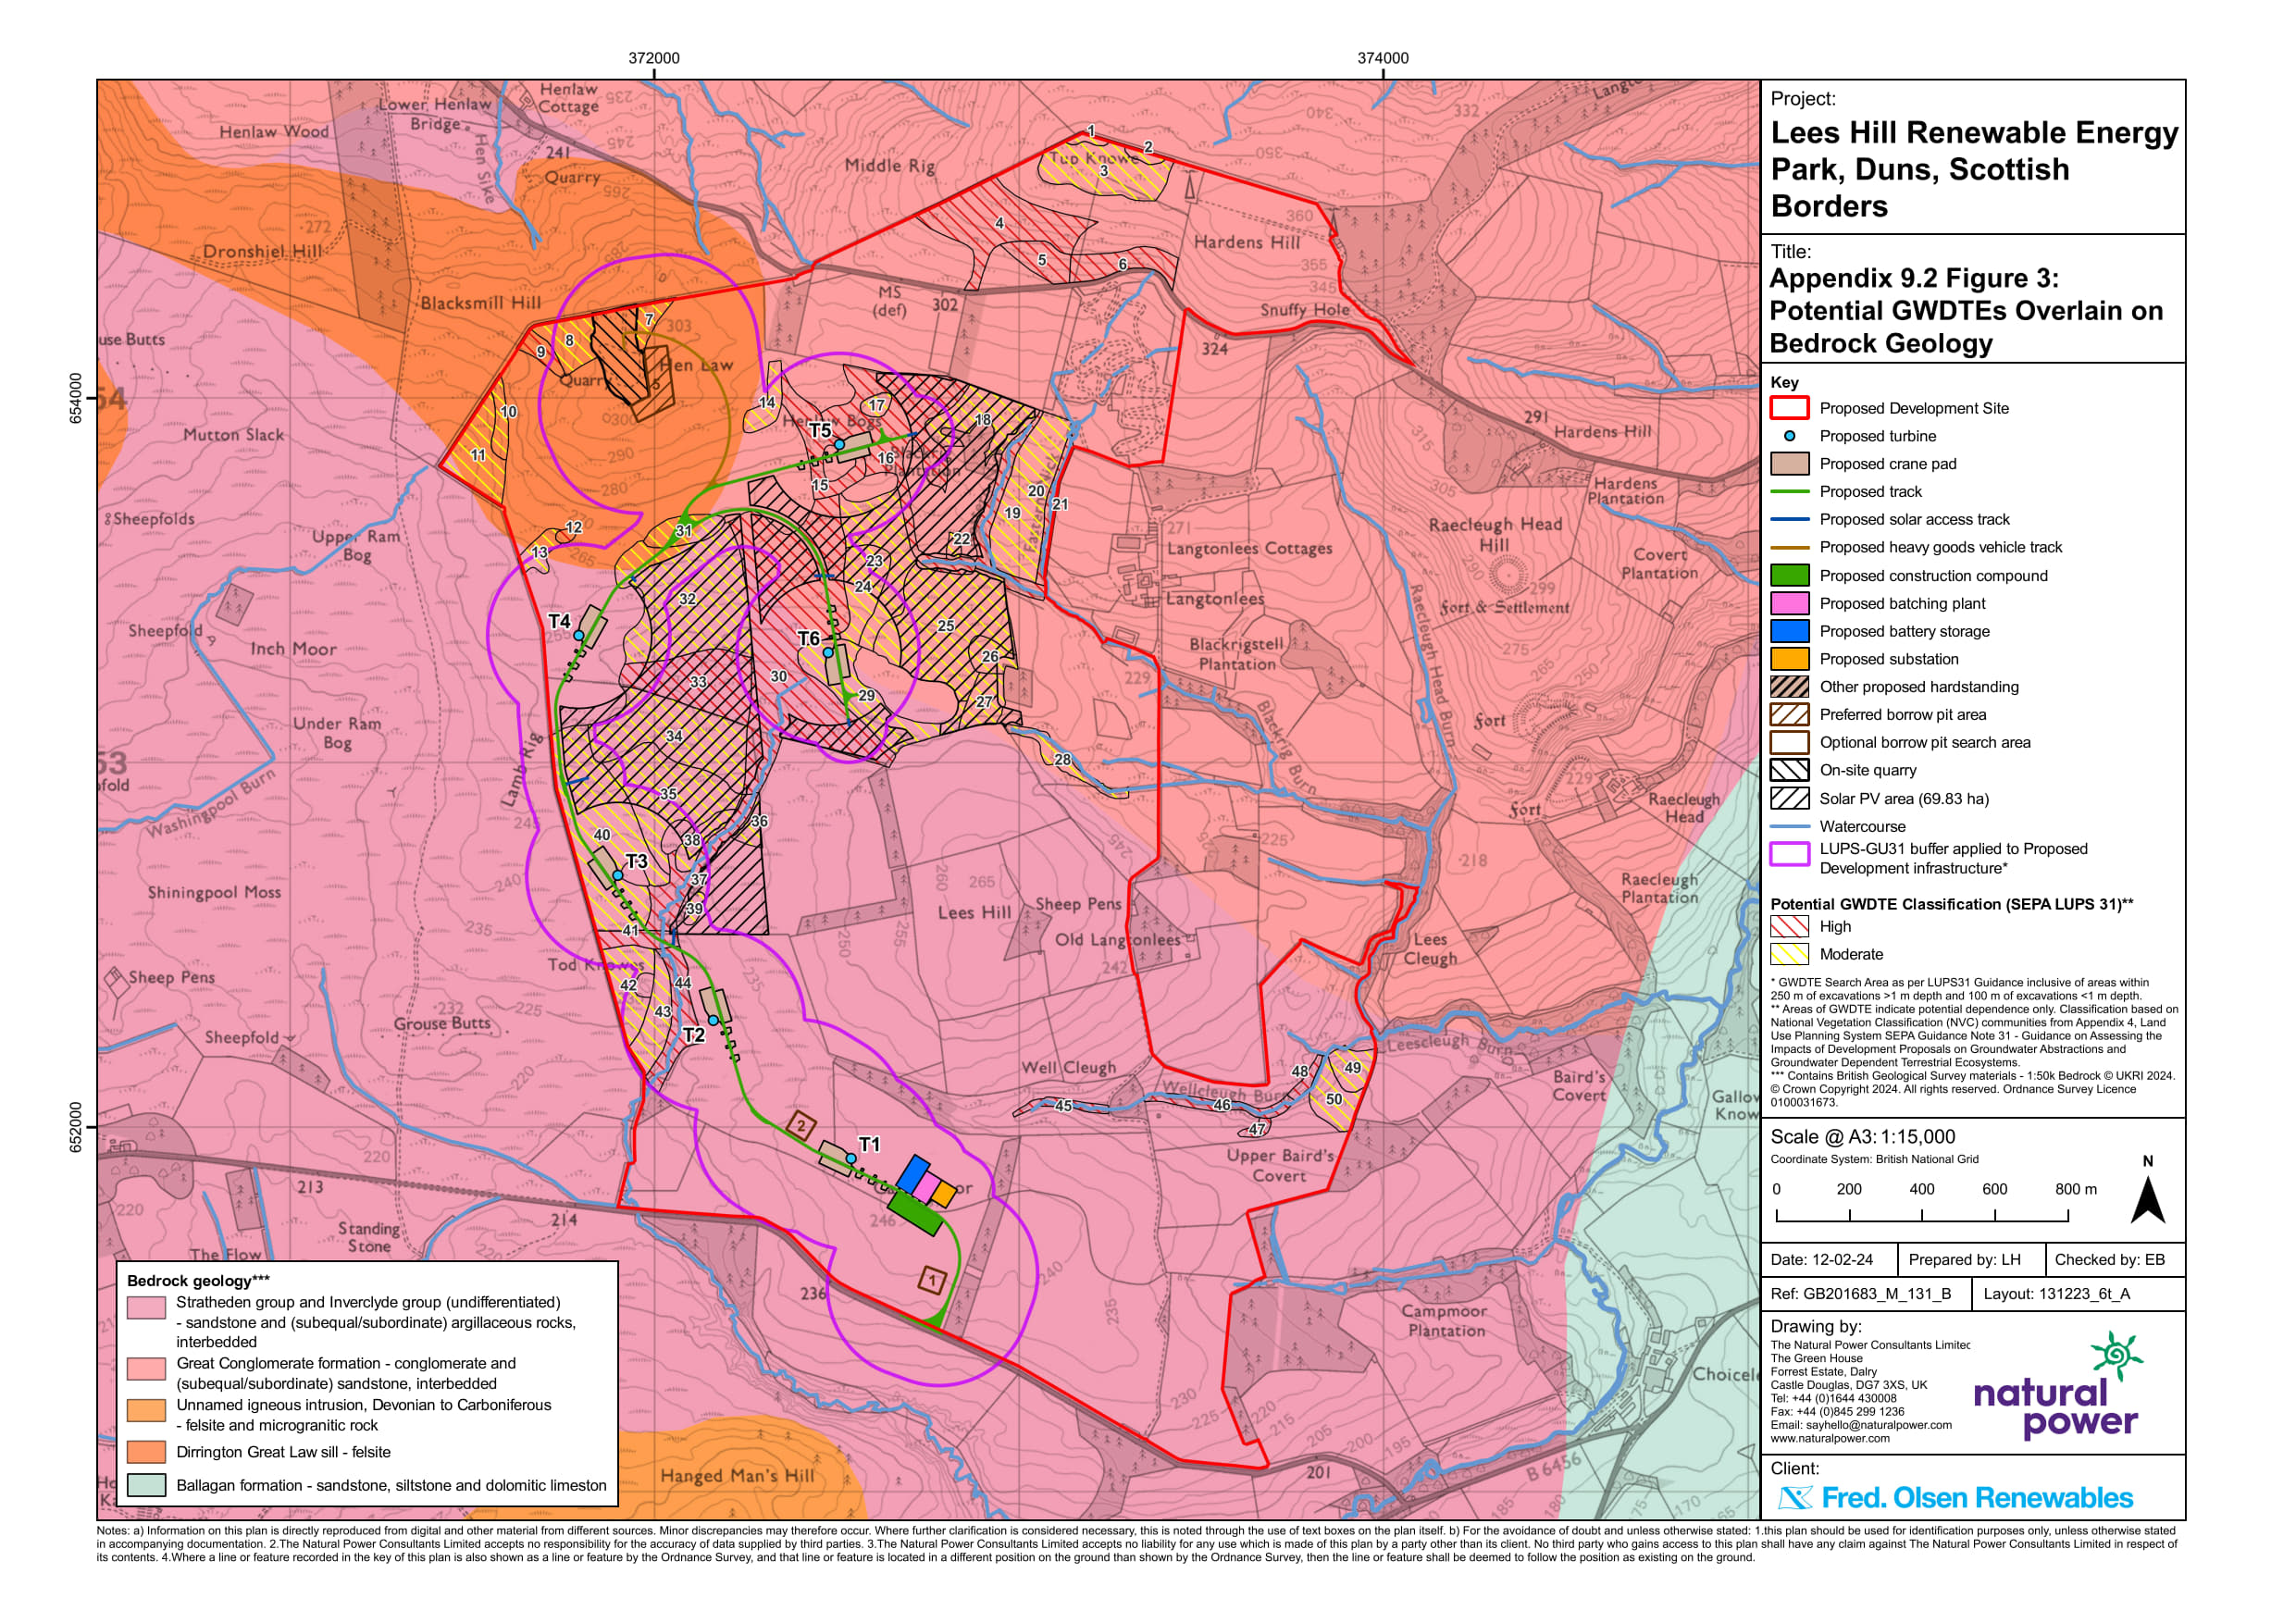
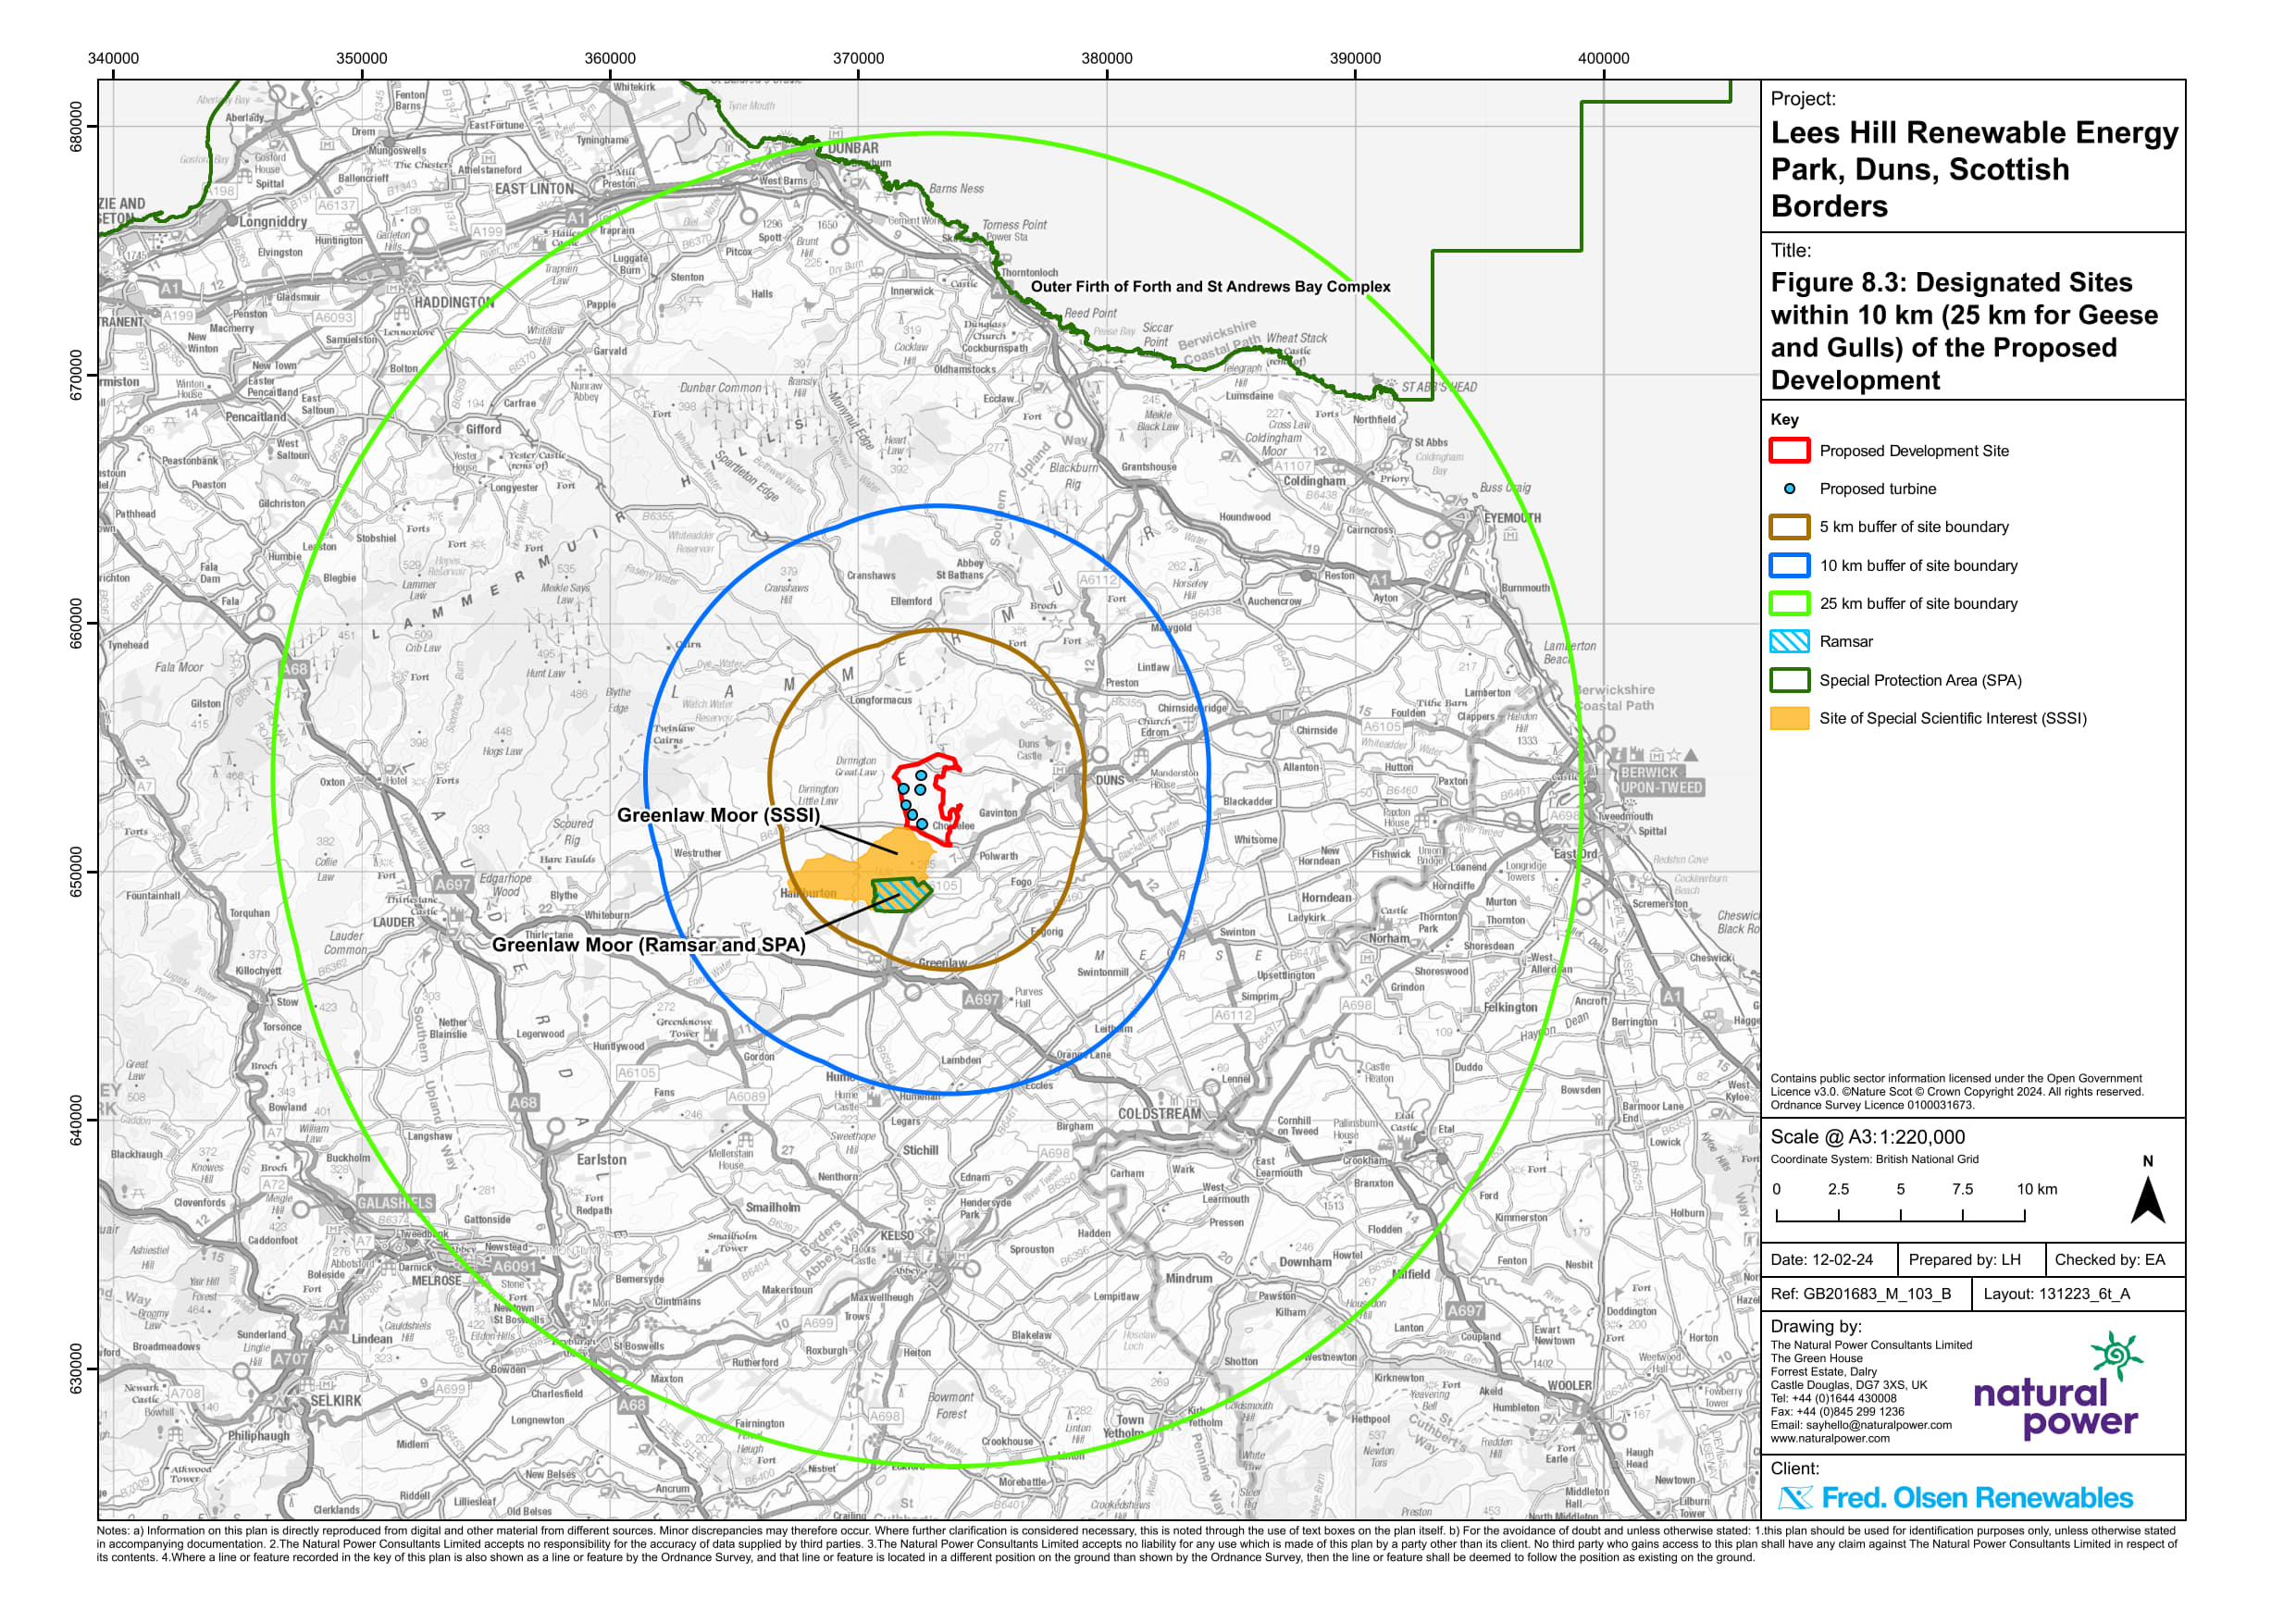
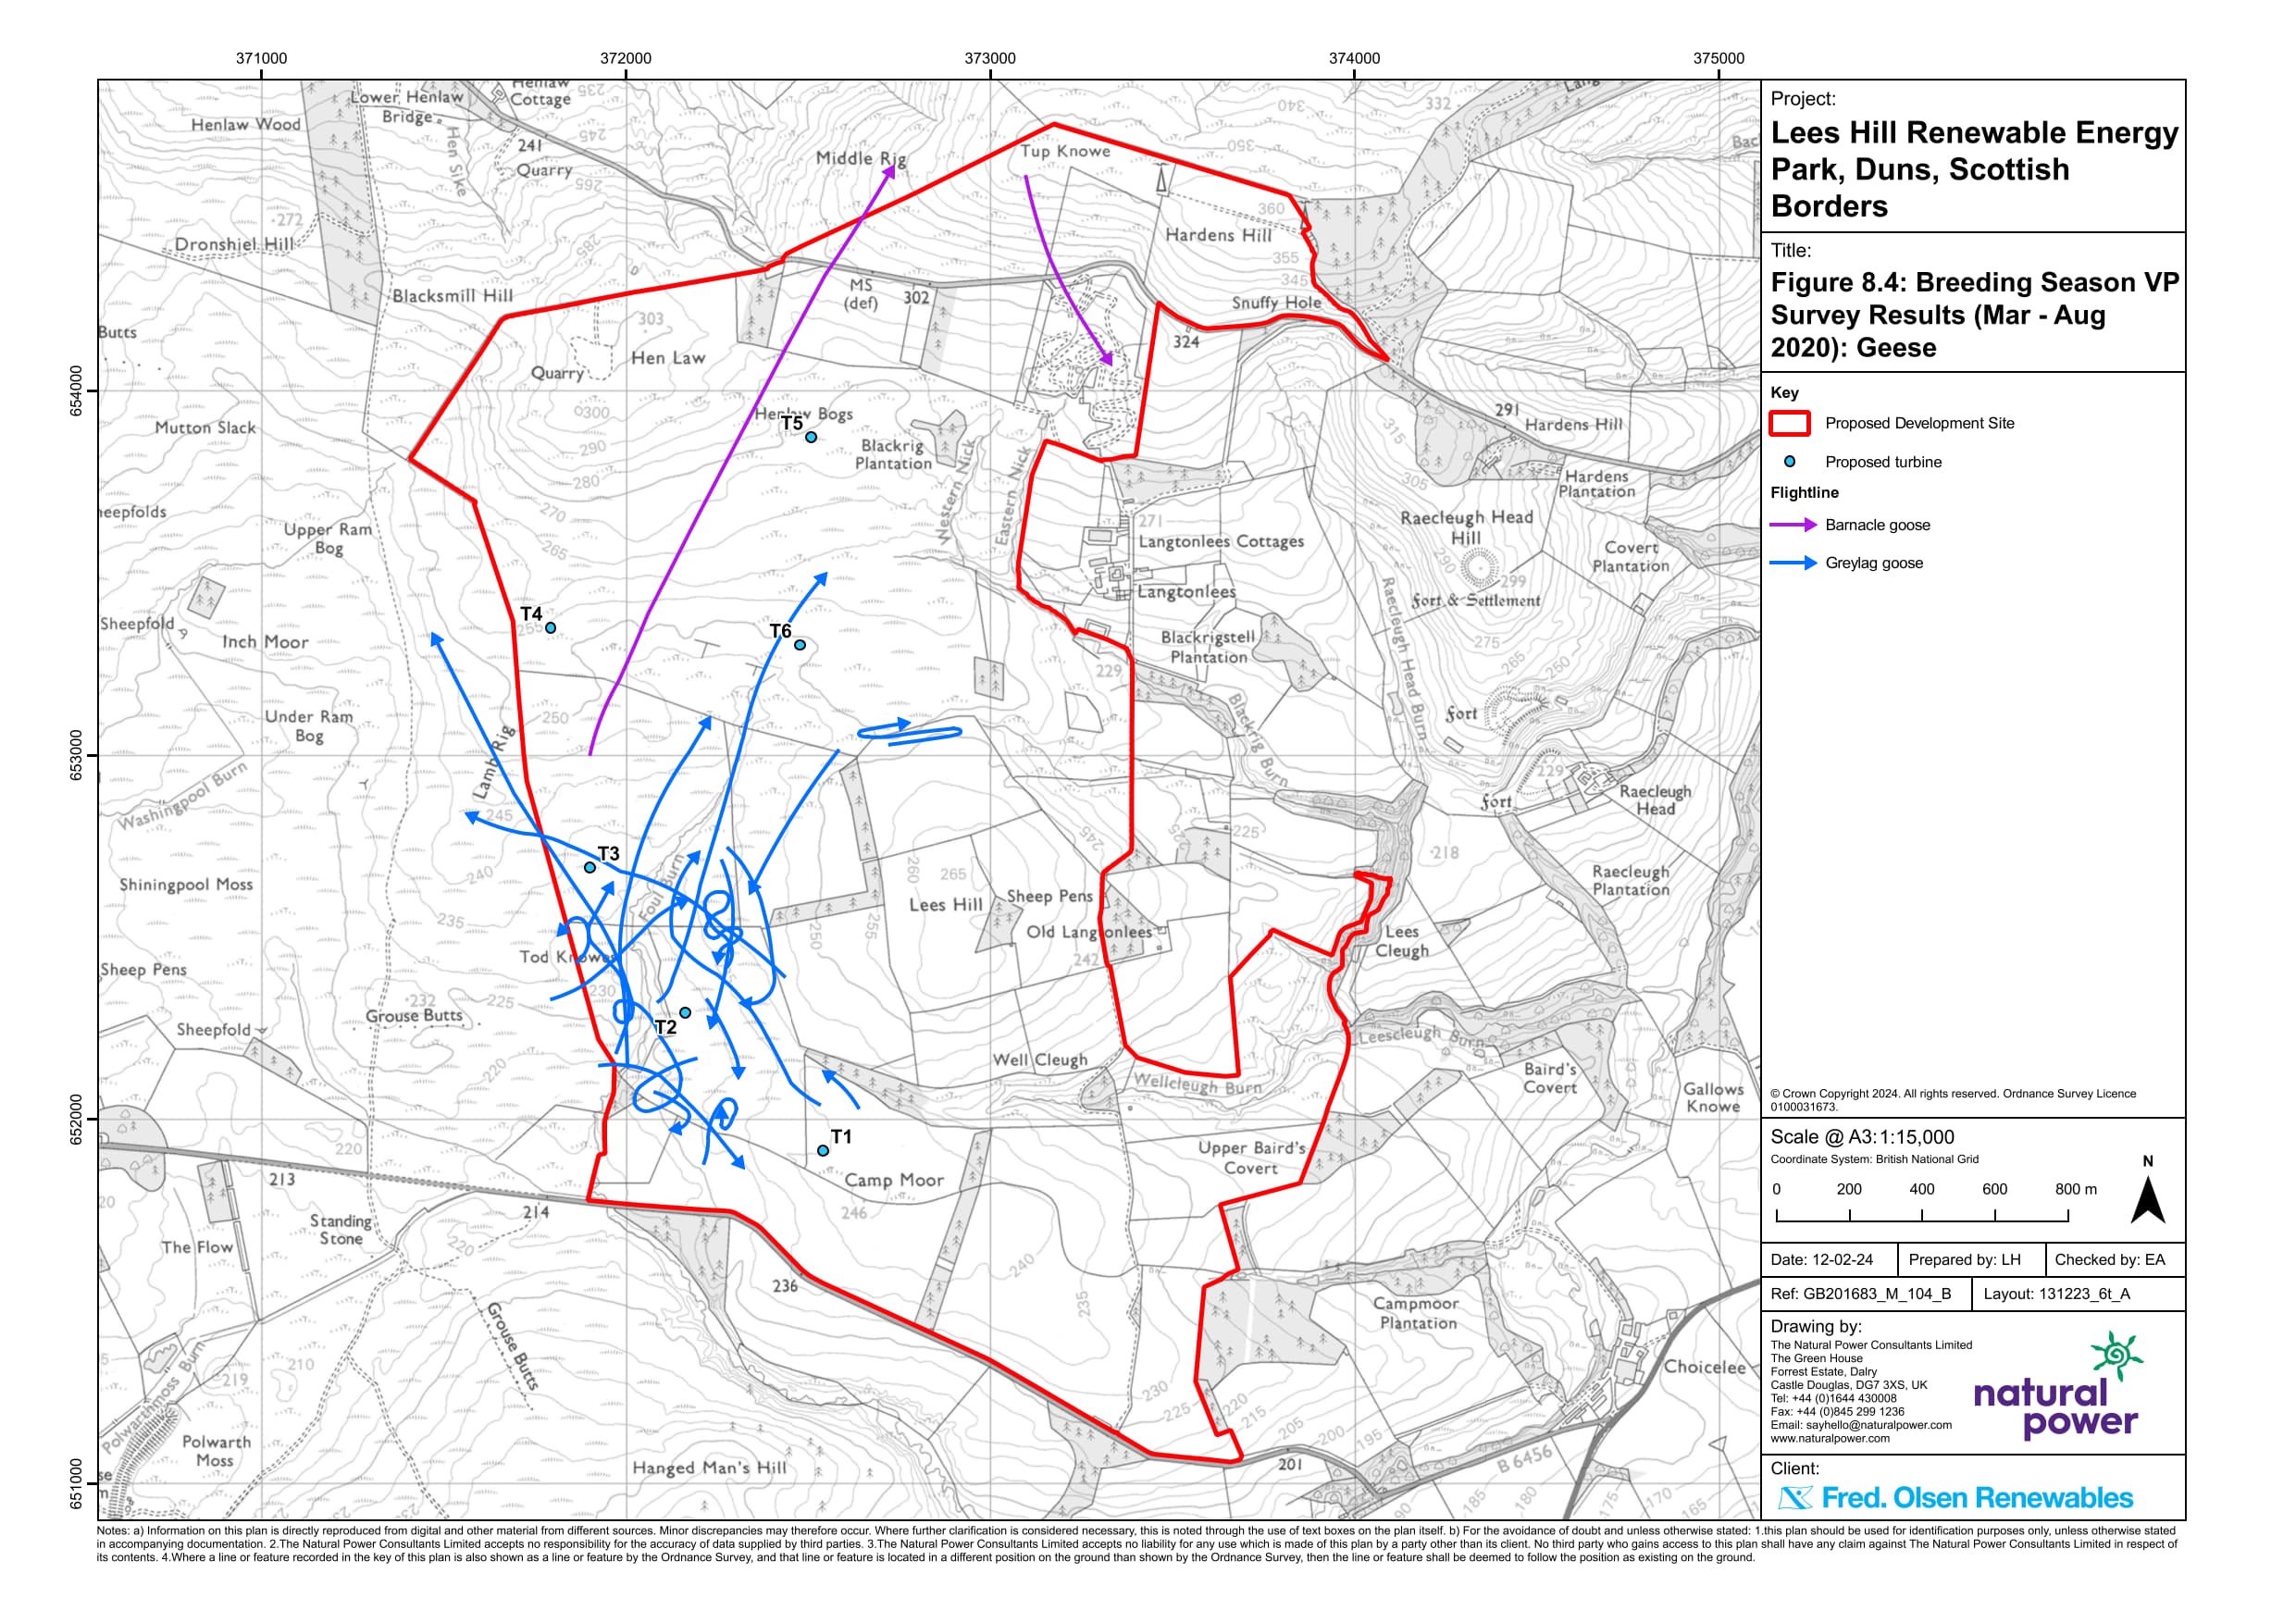
Report figures will be included in the main body text (see Figure 2). Hyperlinks on the figure provide a preview. Zooming features are also enabled that provide a full page version of the figure if clicked on it.
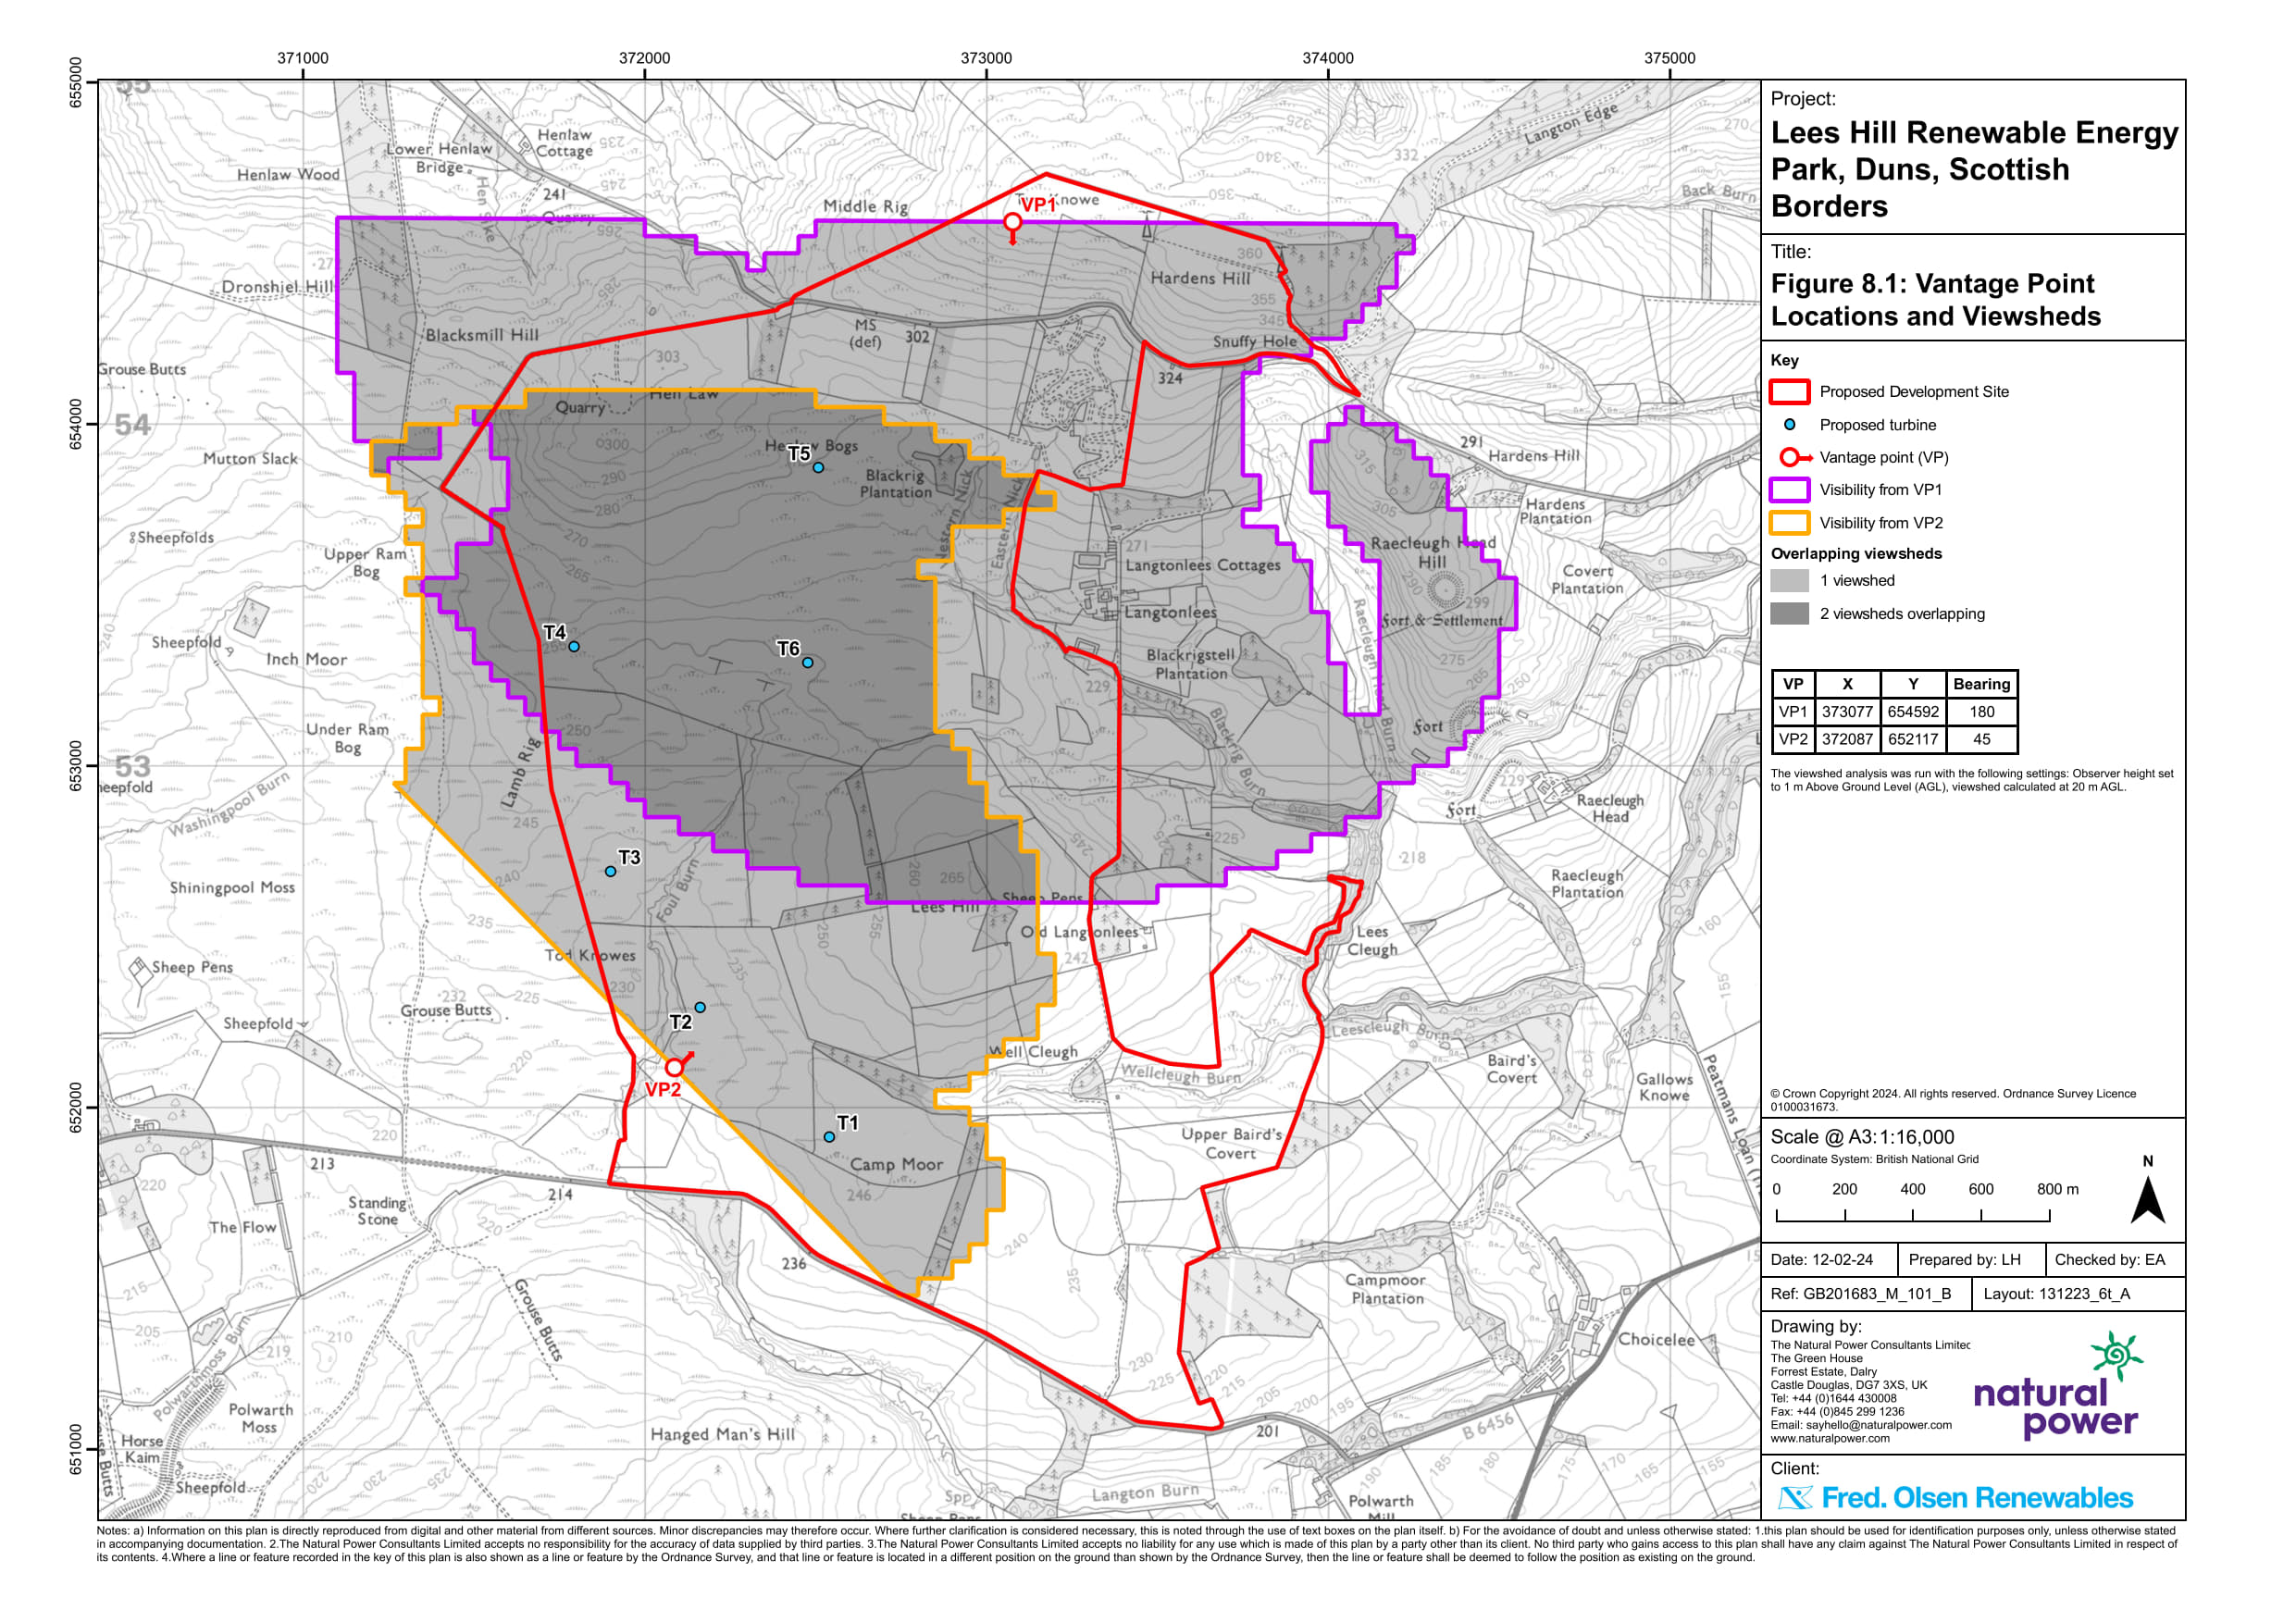
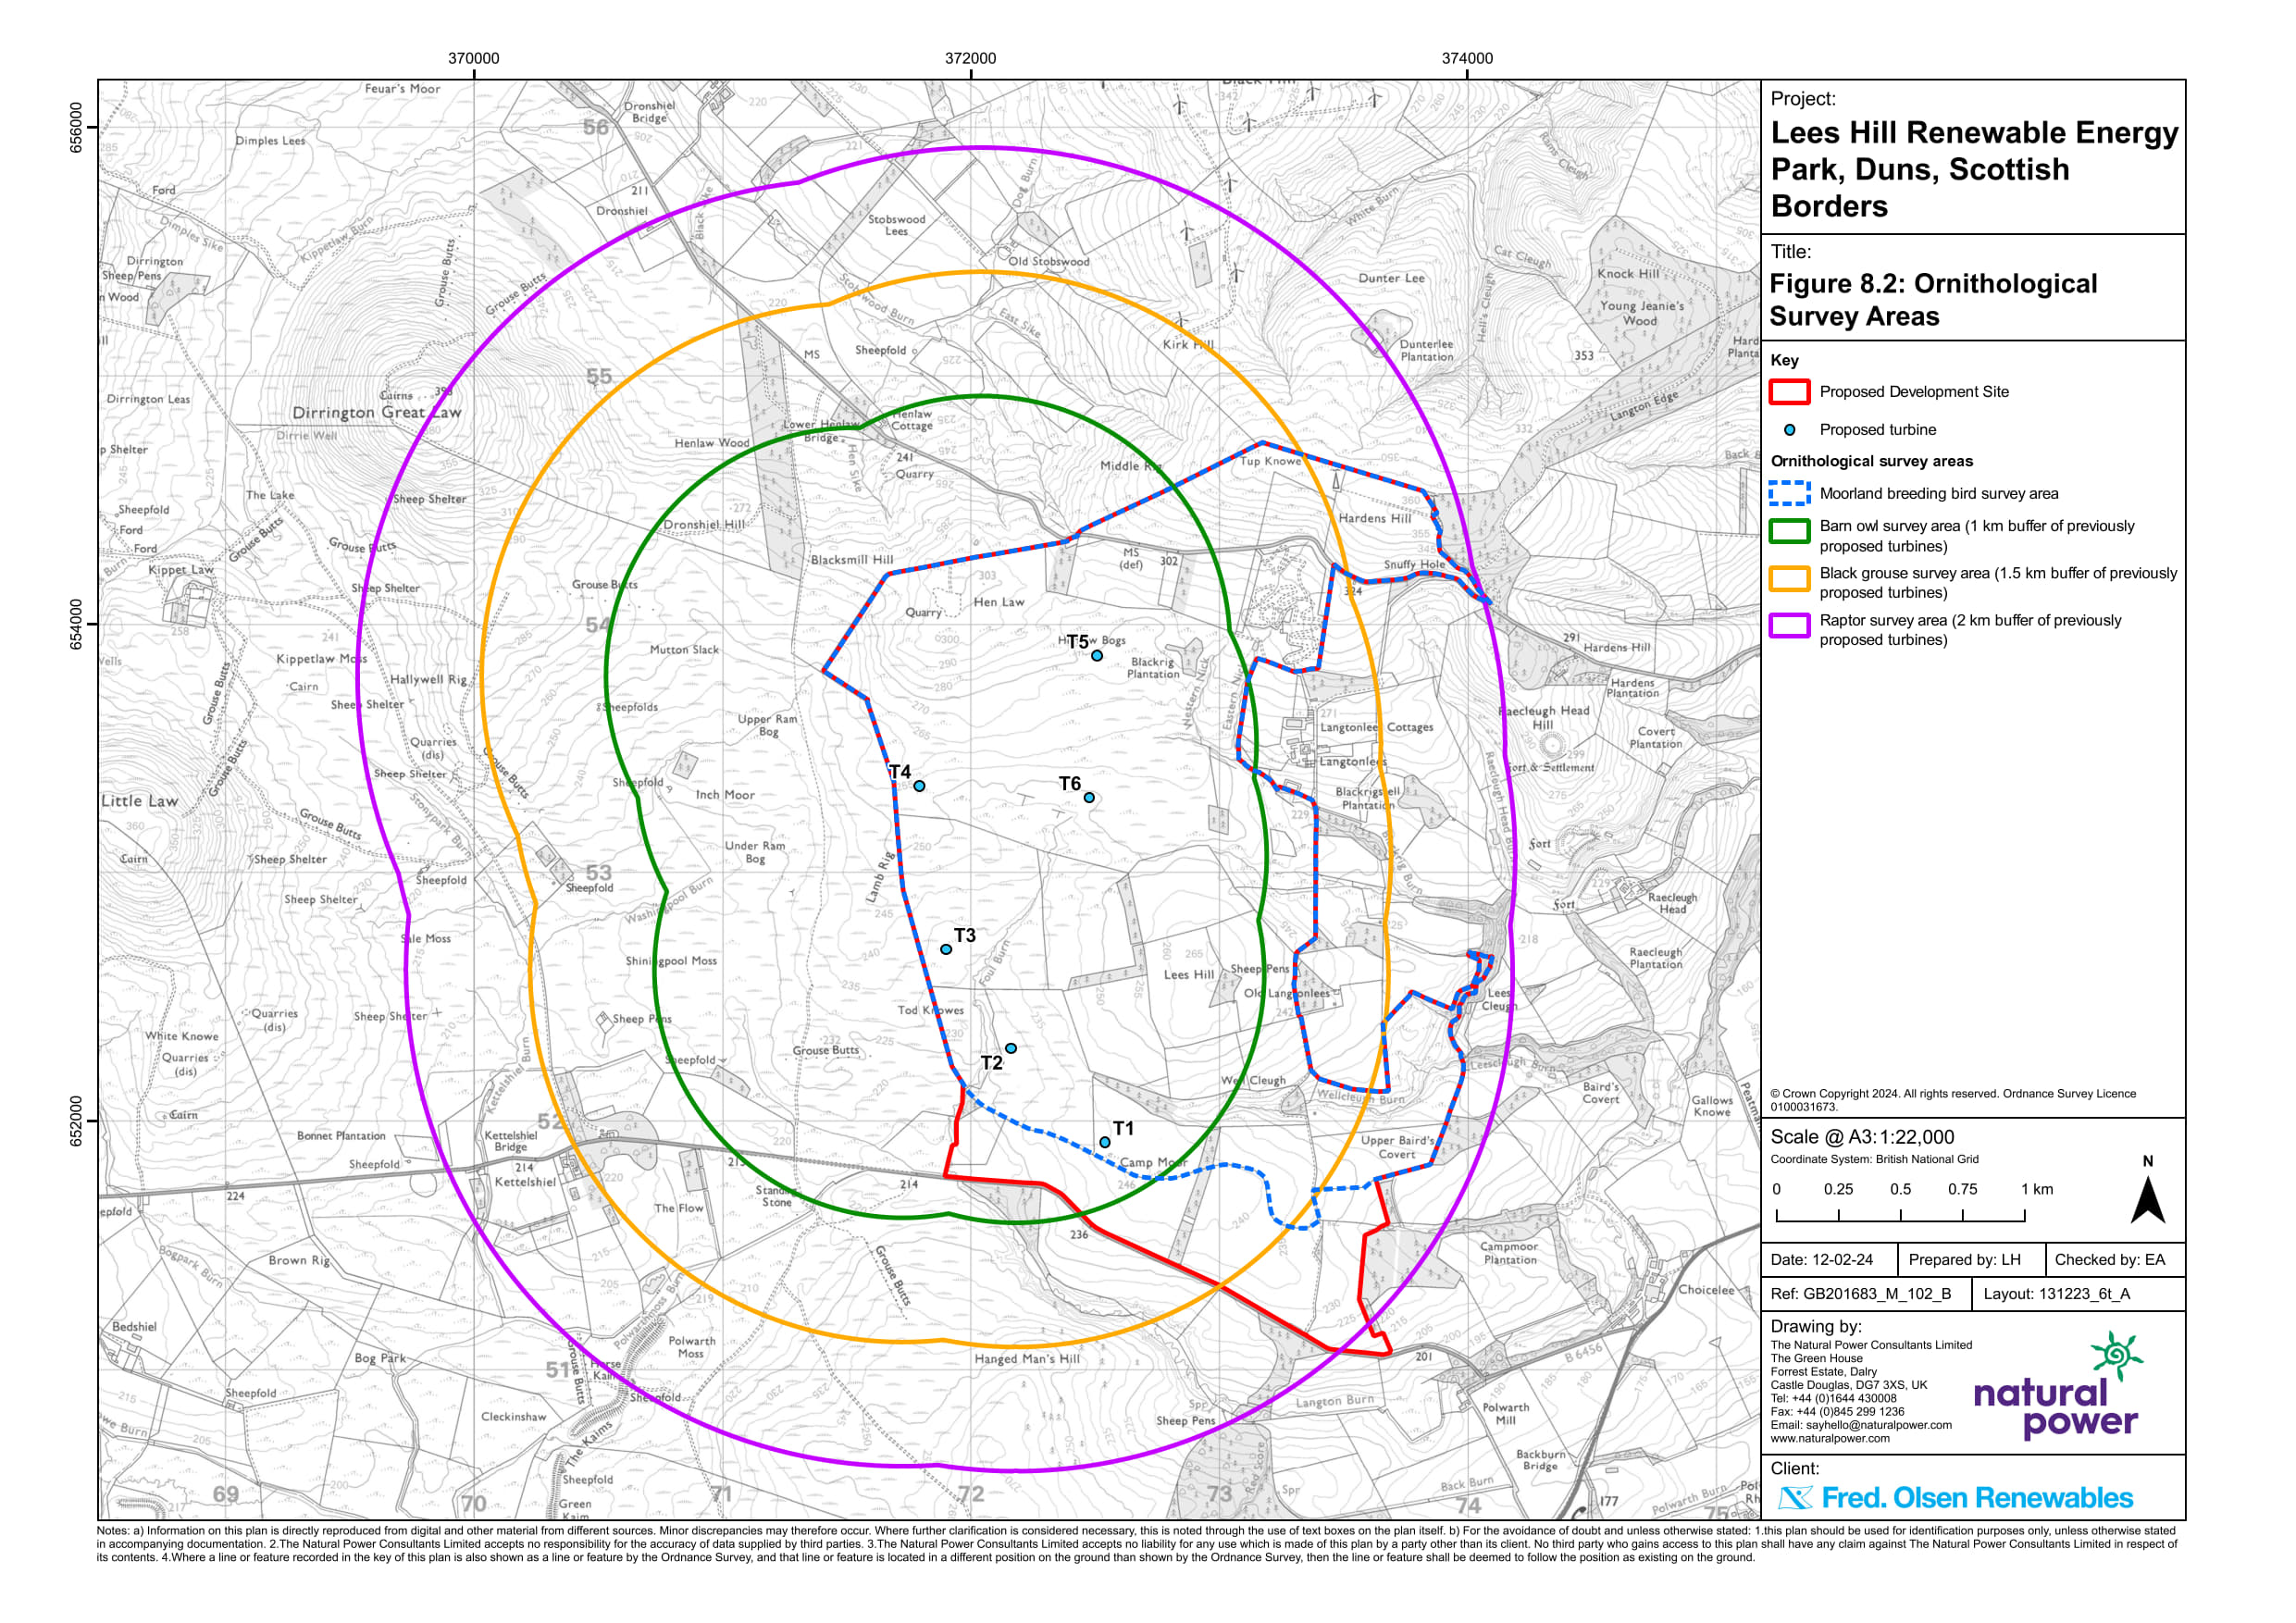
When multiple figures need to be displayed these can be organized in tabsets. If multiple figures refer to a similar topic these can be grouped in a gallery, so that when opened at full page users can flick through them using the available arrows.
As sometimes it is required to refer to figures from other reports we suggest the use of the margin to present a preview of the figure with the hyperlink to the relevant section.
On top of static figures as those presented above, data can also be presented in a more interactive way to provide a new user-experience.
Below we provide an example of an interactive map showcasing the boundaries of offshore wind farm projects across Scottish waters. In this example the interactive map allows to filter project by their current phases. The map can be zoomed in and out, and by clicking on any developments, the name of the development is displayed, to showcase that additional information can be added to any data point displayed.
Tables
Tables often provide critical information but may create a break in the narrative of a report. As such we suggest including all tables in collapsible window, where reader can decide whether to show the presented information.
In digital report tables can also be made interactive, providing additional functionalities, such as being able to search for key words, sort in alphabetical or numerical order, or filter for specific values.
Finally, note that table can be generated directly from raw data this minimizes the human error occurring from transcribing large datasets.
References
Bradbury, G., M. Trinder, B. Furness, A. N. Banks, R. W. G. Caldow, and D. Hume. 2014. “Mapping Seabird Sensitivity to Offshore Wind Farms.” PLOS ONE. https://doi.org/10.1371/journal.pone.0106366.
Footnotes
Example of footnote at the bottom of the page. Use the return arrow to go back to the relevant text.↩︎