Web-based data dashboards offer a powerful solution for bringing together data, visuals and statistics in one accessible digital platform. They can transform complex datasets into meaningful information that is easy to access, interrogate and interpret.
Traditional data sharing generally relies on static displays of information. By contrast, web dashboards provide a dynamic and interactive alternative, enhancing data collation, information display and collaboration.
Key features and capabilities:
At a glance data summary - Key insights are summarised and prominently displayed facilitating instant comprehension of critical or primary information.
Interactive data visualisation - Plots, tables, charts and maps can incorporate a range of interactive features such as filtering, sorting and searching, enabling the user to generate salient data summaries to meet their needs.
Multi data-source integration - Data from various sources can be combined into a single interactive platform.
Customisable interface - Dashboards can be tailored to incorporate any of a wide range of data visualisation options and levels of interactivity as well as company branding or desired aesthetics as required.
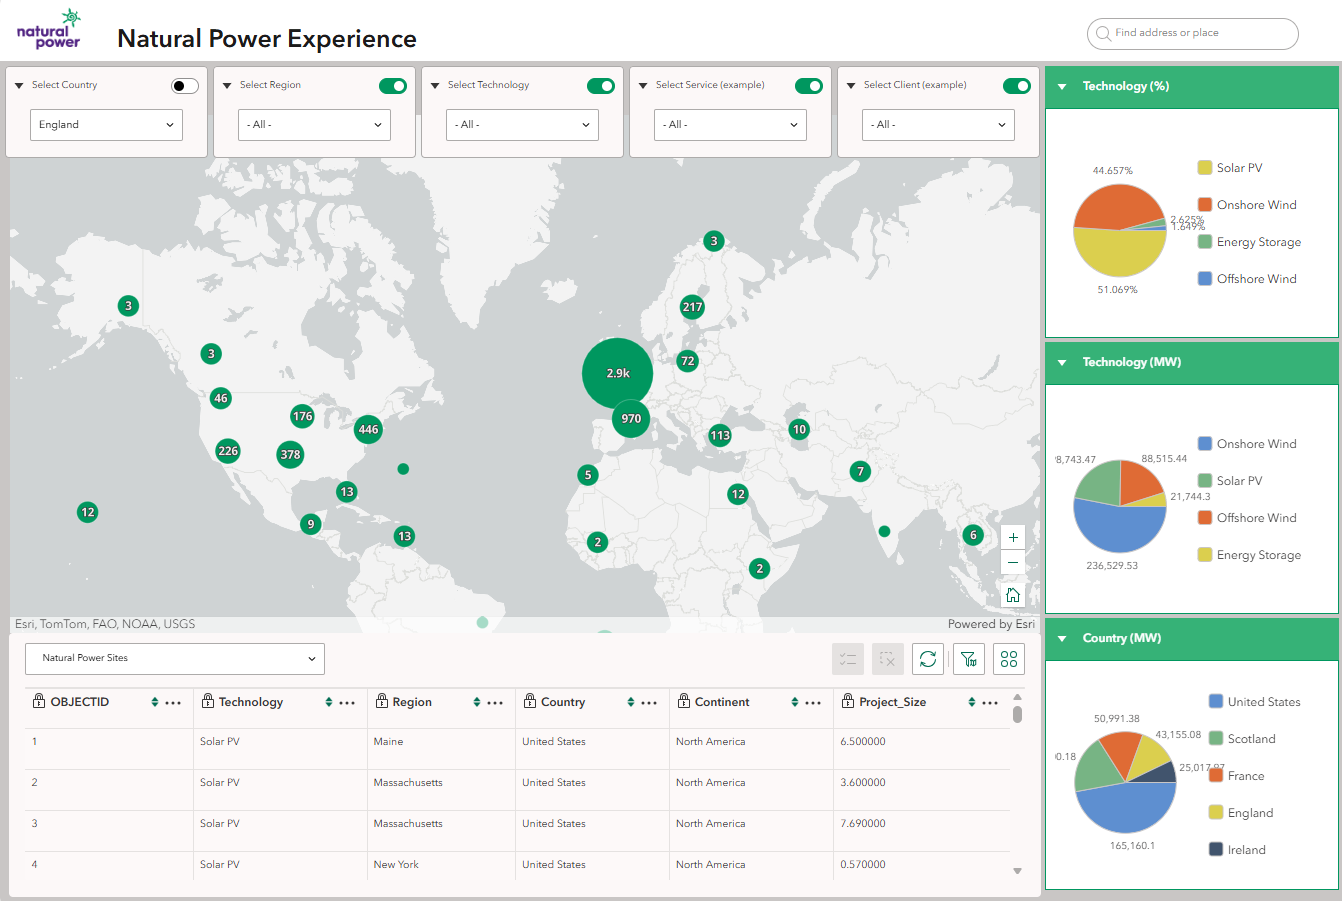
Click the example below to visit an example of our data dashboards: